Urban Heat Is Not Weather, It’s the Consequence of Design: How Satellite Remote Sensing Makes Asphalt, Shade, and Inequality Visible
Original Chinese title: 城市的熱不是天氣,是設計的後果:衛星遙測如何把瀝青、樹蔭與不平等拍出來
Extreme high temperatures are not just weather news but also the result of city design. Satellite thermal infrared data makes visible evidence of differences in asphalt, roofs, shade, and vulnerable communities.
Lawrence Lee | Technology Journalist, Science Fiction Critic, and Space Science Educator
Technology journalist, science fiction critic, and space science educator; long-term focus on space, science communication, technology culture, and future social imagination.
Urban Heat Is Not an Oracle of Equal Arrival
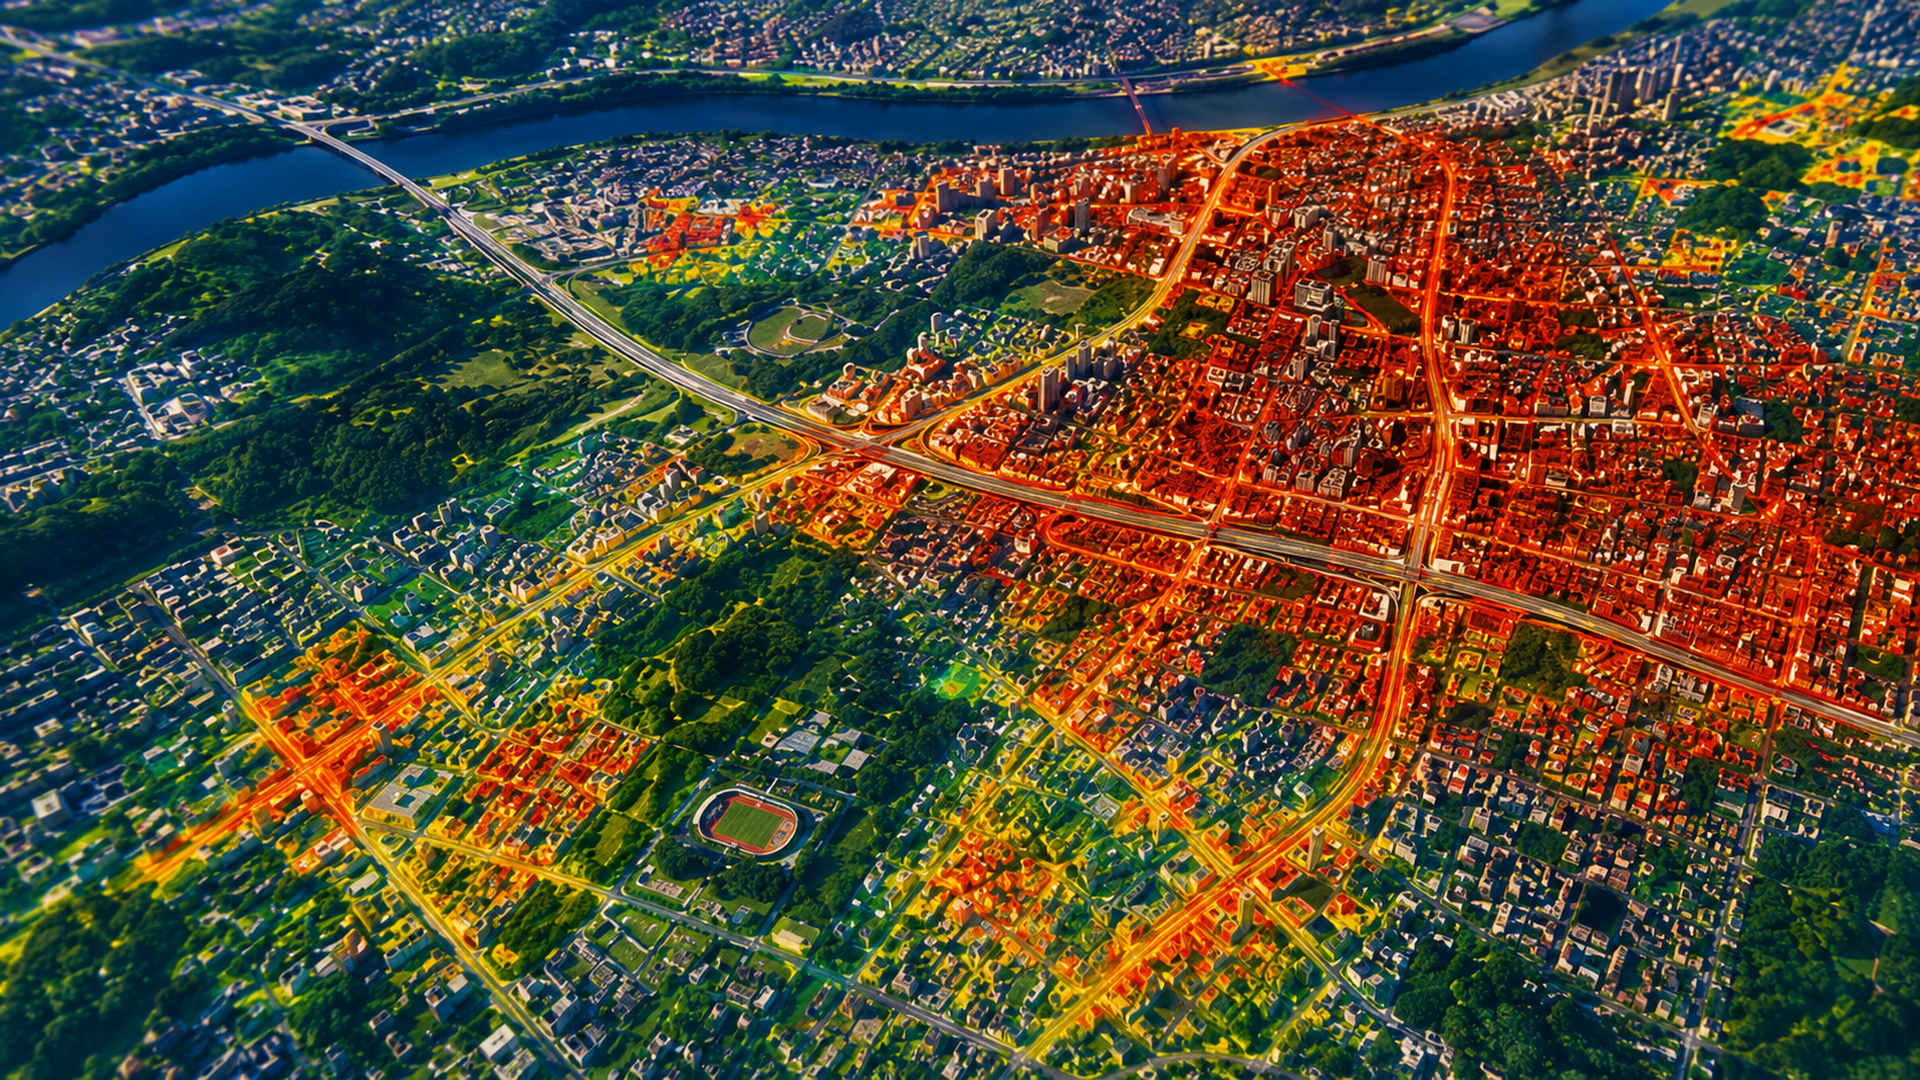
Summer has arrived, and news most often says “it’s very hot today.” That statement is not wrong, but it is too rough. The heat in the city does not fall evenly like a blanket; it is redistributed by roads, roofs, building density, shade, water bodies, ventilation corridors, and social class. Within the same city, some places are preheated like an oven, while others still retain a little breath of shade. The sun seems fair, but urban design is very partial.
This is why satellite remote sensing has become important. Heat is not only felt; it can be measured; it is not only complained about; it can be mapped. When thermal infrared data, surface temperature, vegetation indices, building coverage, and population vulnerability are overlaid, the city suddenly reveals another face: where there is too much asphalt, where shade is lacking, where there are many elderly people with little shading, where rental housing is dense but air conditioning efficiency is poor, where bus stops resemble small frying pans. These details that were once treated as lived experience can now become governance evidence.
The Urban Heat Island Is Not a Natural Disaster; It’s a Side Effect of Civilization
The term “urban heat island” sounds like a meteorological term, but it also reads like a civilization diagnosis. Concrete, asphalt, and dark roofs absorb heat and release it slowly at night; traffic, air conditioning outdoor units, and industrial activities continuously return heat to the streets; open spaces lacking shade expose pedestrians to high temperatures. Thus the city is hot during the day and does not let you off in the evening either. This is not nature suddenly going bad; it is us using materials, energy, and speed to turn the city into a heat storage device.
In black humor, modern cities are like an overly enthusiastic host: they invite you to eat sunlight by day and then pack up residual warmth for you to take home at night. More cruelly, whether one can escape high temperatures is often related to income. Some people can drive, run air conditioning, live in tree-rich communities; others must deliver meals during the strongest sun exposure, wait for buses, work on construction sites, or care for family members. Heat is not equal weather; it becomes unequal health risk along class lines, age, labor type, and living conditions.
Satellites Do Not Only Take Pretty Earth Photos
When many people think of satellites, they imagine space romance, typhoon cloud maps, or military reconnaissance. But in urban governance, a satellite is more like a calm auditor. It does not listen to how beautifully the city government briefs are presented, nor does it care about real estate advertisements claiming livable life; it looks at surface temperature, vegetation, materials, evapotranspiration, hot spots, and temporal changes. The value of thermal infrared observation missions such as NASA ECOSTRESS lies in enabling cities to understand heat island effects at finer scales, even marking out street-level heat-vulnerable areas.
The political significance of such data is obvious. When a high-temperature map is laid open, the city cannot simply get by with gentle nonsense like “planting trees is good.” What must be asked is: where are the tree species? Who gets shade first? Are bus stops, schools, long-term care sites, markets, migrant worker dormitories, social housing, and tin-roofed settlements included in priority cooling measures? If thermal data is only used to make pretty dashboards, ending up with budgets placed on demonstration districts that take the best photos, then science becomes decoration.
Looking at Future Heat Risk Through Urban Archaeology
Urban heat data also has an “archaeological” meaning. It does not dig out pottery shards; it uncovers thermal traces left by past planning. Which era opened many roads, where industrial zones and residential areas are mixed, where river channels were covered, where shade was eaten up by parking demand, and where public facilities placed the elderly and children in high-temperature exposure zones. Satellites photograph these consequences of decisions, like turning over a city’s ledger that has been sun-yellowed.
Therefore, urban heat governance is not just planting trees or lowering air conditioning temperatures. The real question is how cities rearrange materials and space. Light-colored roofs, permeable paving, shaded corridors, campus open green spaces, blue-green infrastructure, heat shelters, night ventilation, street tree maintenance, rooftop photovoltaics, and insulation all need to be viewed on the same risk map. Otherwise we resist high temperatures with energy indoors while continuing to generate them outdoors; this governance approach is like putting out fires while adding fuel to the stove.
Open Data Must Be Usable by Communities
If urban heat data remains only in expert platforms, it easily becomes “looks scientific but no one knows how to use it.” Truly effective heat governance requires translating data into community-understandable action language: which school routes are hottest? Which bus stops need shade canopies? Where should the elderly avoid going out at noon? Which market stalls require cooling facilities? Which community activity centers can serve as heat shelters? Data is not for proving how smart a city is; it is to make residents suffer less.
This also reminds Taiwan’s local governments that climate adaptation cannot rely solely on the aesthetic format of central subsidy projects. Many townships, urban edges, and mountain-sea border areas lack large research teams to help map, yet they face high temperatures, torrential rain, broken roads, and population aging just as much. If satellite data, open data, and local observations can be combined, heat risk can become concrete problems at street corners, rooftops, bus stops, and vegetable markets rather than abstract climate change. Climate governance fears being too grand; when it becomes so large that no one knows which section of the arcade to repair tomorrow.
The Justice of Heat Is Turning Shade into Infrastructure
In the past we treated shade as scenery, parks as leisure, water bodies as beautification, and roof insulation as private matters. In an extreme high-temperature era, all these must be redefined as infrastructure. Trees are not pretty backgrounds but cooling equipment; shade is not a bonus benefit but public safety; walkable cities are not literary slogans but public health policies. When heat waves arrive, whether a city is civilized does not lie in how beautiful its skyline is, but in whether the most vulnerable people can safely reach bus stops.
Satellite remote sensing makes it impossible to say “we don’t know where it’s hottest.” Knowing and then doing nothing is the real problem. Urban heat is not simply weather; it is a consequence of design; since design caused it, it must be corrected with design, budgets, and institutions. Future city competitiveness will not only compare investment promotion, metro lines, or luxury housing, but also who can minimize high-temperature risk to the greatest extent. After all, a city where people dare not go out in summer is smart only if it’s equipped with Wi-Fi on a baking tray.
The Next Step for Taiwan Cities
Taiwan’s high-temperature governance is easily split into several departments that do not speak to each other: meteorological units handle forecasts, health units issue public education, engineering units manage roads, education units oversee campuses, social welfare units care for the elderly, and environmental units focus on carbon reduction. But heat waves do not act according to government organizational charts; they simultaneously enter rooftops, hospital wards, vegetable markets, bus stops, construction sites, and schools. Future heat governance must pull these data into a single line so that hotspot maps can determine engineering priority orders, medical and social welfare data can identify high-risk groups, and schools and communities know when to activate cooling arrangements.
This is not about turning every city into a data center; it is about making cities acknowledge: heat has become a public safety issue. When satellites photograph heat, governments should not just put it into briefings. Truly useful maps should ultimately become trees, shade canopies, ventilation, subsidies, work-hour regulations, and community care. In science fiction, satellites often monitor the world; in reality, better satellites should help us take care of the world so that it is less scalded.
Sources retained from the Chinese original
AI use and content-safety disclosure
This article was assisted by AI for data organization, structural drafting, and sentence polishing; human editors set the viewpoint and fact-checking direction