About Ten Percent Less Atmospheric Dust: Why a Twenty-Year Trend Matters Beyond Air Quality
Original Chinese title: 天空少了約十分之一的沙塵,為什麼影響不只空氣品質?二十年觀測如何重畫土地、風與暖化的關係?
Multiple observing systems indicate a roughly ten percent decline in global airborne dust from 2003 to 2023; causes and consequences remain under study.
Lawrence Lee|英國里茲大學學者|科技媒體人、科幻評論者與太空科學教育工作者、關注能源、材料、文明基礎設施與科技敘事
A University of Leeds scholar, technology journalist and science educator writing on energy, materials and civilization.
What fell by about ten percent?
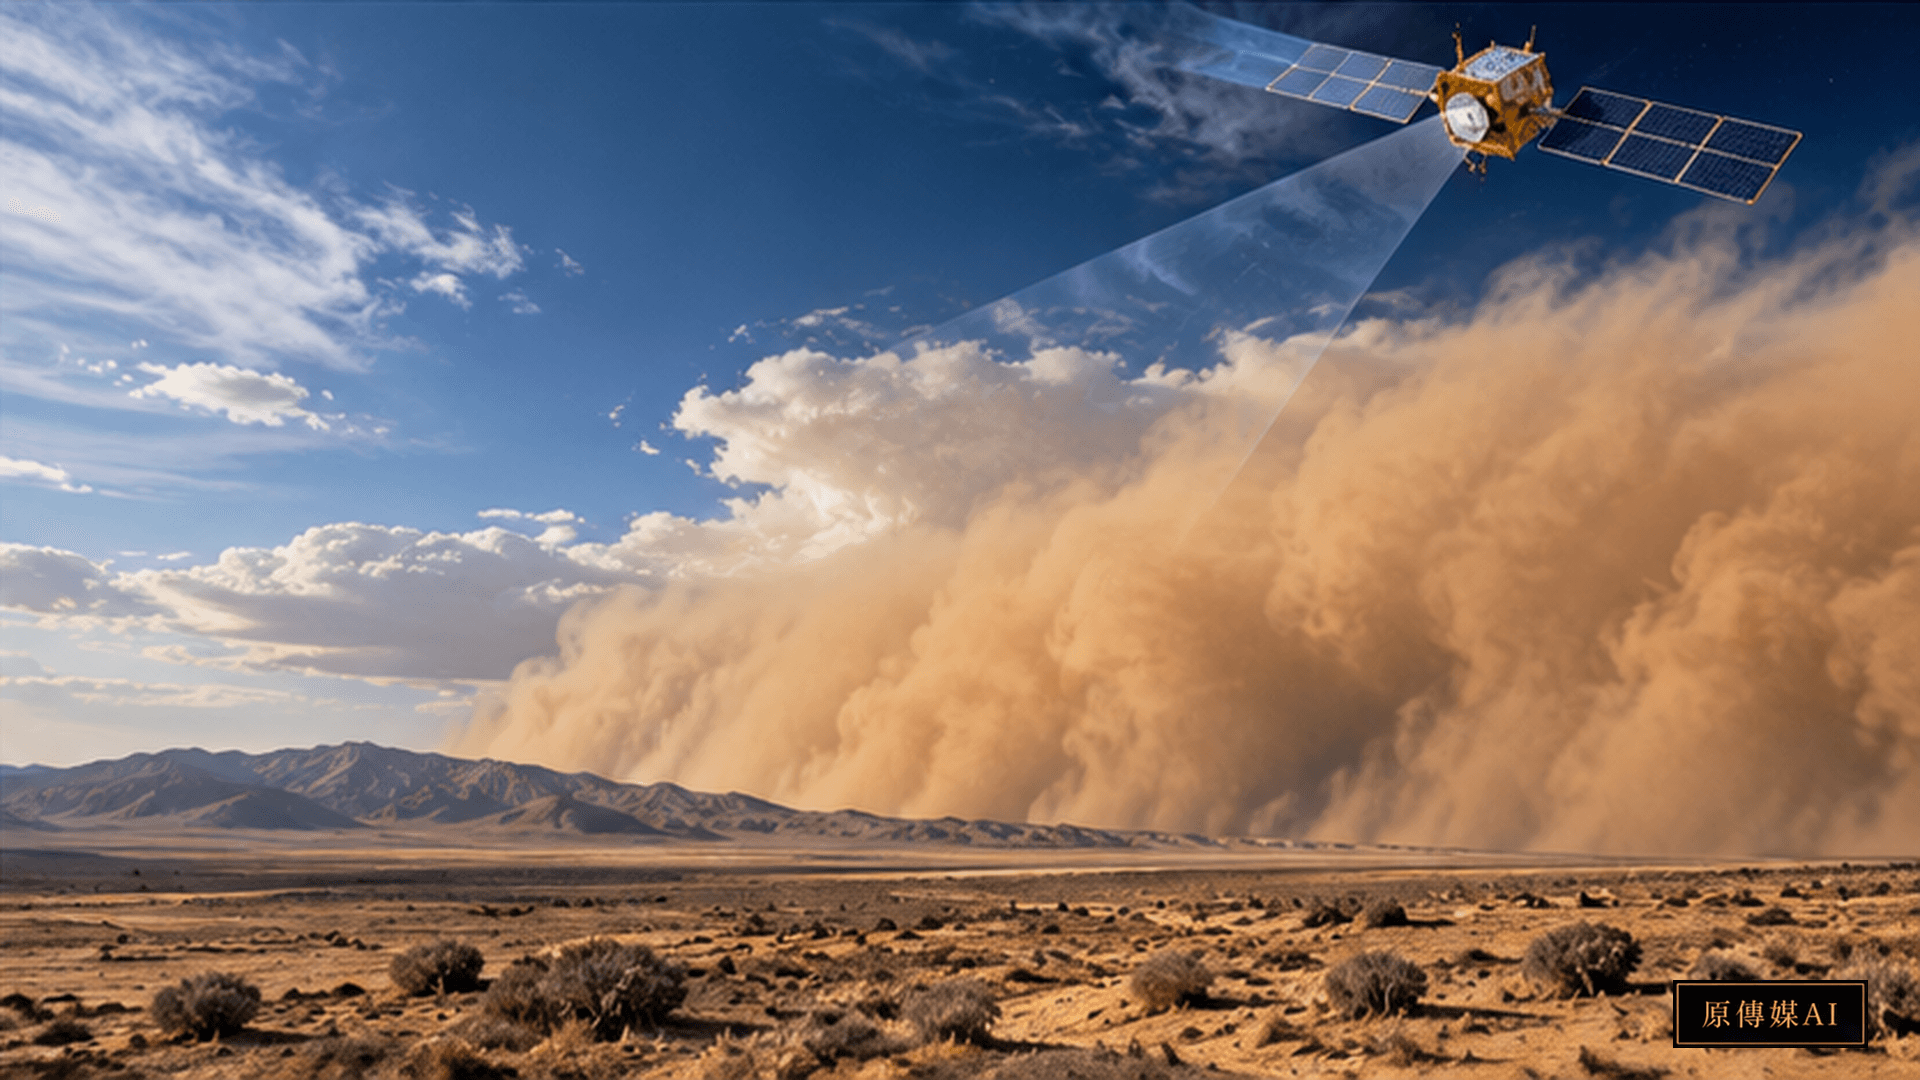
UCLA researchers combined satellite observations, ground measurements and atmospheric models to estimate that the global amount of airborne desert dust fell by about ten percent between 2003 and 2023. This is not a claim that particulate pollution in every city fell by ten percent or that deserts shrank by that amount. Atmospheric burden depends on emissions, transport, deposition and measurement. Agreement among datasets strengthens an estimate without making every region identical.
How the evidence can be revisited
The UCLA release reports the Science Advances study and its regional variation. A Zenodo record supplies processed observational datasets, including several satellite products, reanalyses and stations, with plotting code. A separate DustCOMM record supports reproduction of the inversion method. The records let specialists inspect calculations, while general readers can begin with the years, variable, region and uncertainty behind the headline number.
Why dust matters for climate
Mineral dust scatters and absorbs sunlight and interacts with clouds, surfaces and longwave radiation. Particle size, composition and altitude influence its net effect. The research team says dust has a slight overall cooling effect and that its recent decline may have contributed modestly to warming driven by human greenhouse gases. It does not replace greenhouse gases as the primary cause of warming or yield one exact temperature increase from a single burden estimate.
Air quality and nutrient delivery differ
Less dust can reduce exposure in some places, yet a lower global average does not guarantee cleaner air in every community. Dust also carries minerals to oceans and land and can darken snow and ice. The consequences depend on where particles travel and what they contain. Public health, radiation and ecosystem nutrients need distinct indicators rather than a single judgment that less dust is entirely good or bad.
The cause is still being investigated
UCLA says researchers are still determining how changing winds, surface conditions and other environmental factors contributed to the global decline. Dry lakebeds affected by water use can become important local sources, but a local example is not a global explanation. Warming can alter winds, rainfall, vegetation and soil moisture in different directions. A two-decade trend describes what happened more securely than why it happened.
How to report model uncertainty
Satellites detect optical signals, stations measure particular locations, and models connect observations through assumptions. Coarse particles, clouds, reflective surfaces and instrument changes can affect retrievals. Cross-checks improve confidence but do not remove limits by region or season. Where models disagree, reporting should distinguish stable conclusions from estimates sensitive to data choice or parameters.
Taiwan needs local exposure evidence
Taiwan experiences transported dust and local resuspension under different conditions. A declining global burden does not establish that a particular season or coastal community has less exposure. Local assessment needs air-quality stations, particle composition, weather and transport paths, separated from other pollution sources. A global trend should not cancel local alerts, and one dusty day does not refute a twenty-year average.
The next questions
The result links land surfaces, winds, atmosphere and oceans across different time scales. Next steps include attributing drivers, checking regional and particle-size changes and estimating uncertainty in radiation effects. Open data and model records allow methods to be examined. Public decisions should maintain local monitoring and distinguish health, climate and ecological outcomes. The decline is an observation; its full causes and consequences remain research questions.
A global mean hides regional change
The ten-percent estimate is global; regions and seasons need not move together. Dust may rise in one source region while falling elsewhere, and altitude affects ground exposure. Maps should show uncertainty as well as color, because visual intensity is not uniform measurement quality.
Dust is not all pollution
Urban fine particles can come from vehicles, industry and secondary chemical formation as well as mineral dust. Different sources require different responses. Health assessment needs particle size, composition, exposure time and vulnerable groups. A global dust study cannot replace local air-quality forecasts.
Land change needs location evidence
Dry lakebeds, irrigation and vegetation can influence emissions in different ways. A documented local source cannot explain the entire global decline. Testing land drivers requires matched surface, wind, soil-moisture and dust-source data, including plausible alternatives. Local managers need to identify local sources before applying a global average.
Open data require careful use
Zenodo records provide datasets, plotting code and an inversion model. Products have different resolution, gaps and periods; adding files together is not a valid new trend. Reproduction needs versions, units and parameters, with a clear distinction between measurements and modeled estimates. Open code improves scrutiny but does not erase assumptions.
Three public questions
First ask what was observed: did the global burden fall? Next ask attribution: how did winds, land and climate contribute? Finally ask consequences for warming, oceans, snow and breathing exposure. Evidence is strongest for the observed decline, while causes remain under study and effects follow several pathways. Combining all three into one sentence overstates certainty.
Do not turn a possible effect into a measured outcome
A dust trend and a warming trend occurring together do not by themselves establish causation. Radiative calculations and counterfactual comparisons are needed. The overall slight cooling effect also depends on region, particle size and clouds. Multiple datasets support a falling global burden; its contribution to recent warming is possible and still needs quantification. Greenhouse gases remain the dominant human warming driver.
Bring maps into dialogue with community experience
A global map can reveal a broad signal while missing dust near a home, dry riverbed or construction site. Local measurements and residents’ observations identify places requiring closer study. Source and trend claims still need consistent sampling and weather context. Keeping global, regional and neighborhood scales distinct prevents both overpromising from a global decline and dismissing a local exposure.
Sources and further reading
Role-Driven Inquiry
Yuan Media AI | Guided Questions by Role
Select a role first, then review the complete questions from that perspective; clicking a question will display Yuan Media AI’s response in real time.
Select a role
Readers and families
Examine the article's evidence, governance boundaries, data rights, and actionable steps from the perspective of a Readers and families.
Choose a question
AI use and content-safety disclosure
AI assisted writing and translation. Direct evidence, interpretation and implications for Taiwan are distinguished.